Table 1, regression, Kaplan–Meier and Cox models — exported as Word tables that don't break, with a Methods paragraph and the R script you keep. Runs entirely in your browser.
We'll email you once when the beta opens. Waitlist members get founding prices.
Built for clinicians and students who need a correct analysis and clean tables for a paper — without learning R or paying a statistician by the hour.
CSV, Excel, SPSS (.sav) and Stata (.dta). Variable types are detected and you confirm them before anything runs.
Table 1 with appropriate tests and SMD, linear and logistic regression, Kaplan–Meier with an editable number-at-risk table, Cox with a proportional-hazards check.
Flags tiny groups, sparse cells and violated assumptions, and explains which test was used and why.
A .docx with real Word tables in journal style — not screenshots, not broken tab-separated text.
Generated from the analyses you actually ran: tests, models, software and package versions.
Download a script that reproduces every number in standard R. Reviewers can check it; you never lose access.
Real output from our working prototype, with R running inside the browser on the public survival::lung dataset (NCCTG lung cancer trial).
| Characteristic | Overall N = 228 | Male N = 138 | Female N = 90 | SMD | p-value |
|---|---|---|---|---|---|
| Age, years | 63 (56, 69) | 64 (57, 70) | 61 (55, 68) | 0.25 | 0.057 |
| ECOG performance status | 0.11 | 0.737 | |||
| 0 | 63 (28%) | 36 (26%) | 27 (30%) | ||
| 1 | 113 (50%) | 71 (52%) | 42 (47%) | ||
| 2–3 | 51 (22%) | 30 (22%) | 21 (23%) | ||
| Weight loss, lb | 7 (0, 16) | 8 (1, 19) | 4 (0, 11) | 0.27 | 0.029 |
| Calories per meal | 975 (635, 1,150) | 1,025 (768, 1,175) | 925 (588, 1,075) | 0.36 | 0.022 |
| Died during follow-up | 165 (72%) | 112 (81%) | 53 (59%) | 0.50 | <0.001 |
| Median (Q1, Q3); n (%). Wilcoxon rank-sum test; Pearson's chi-squared test. SMD, standardized mean difference. Missing values omitted from this excerpt. | |||||
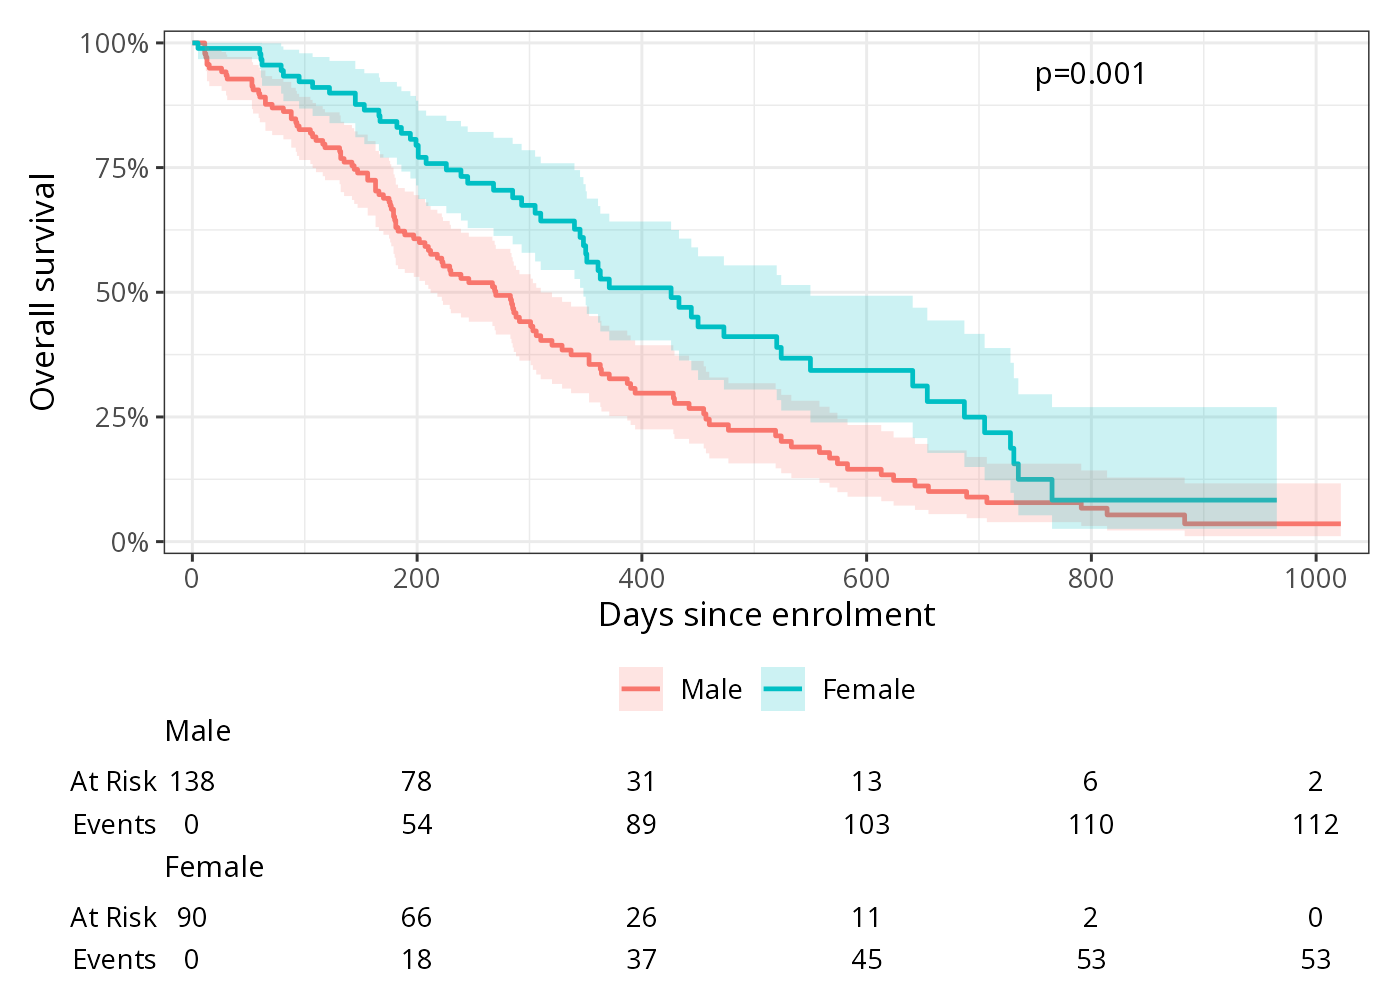
Continuous variables are presented as median (Q1, Q3) and were compared using the Wilcoxon rank-sum test; categorical variables are presented as n (%) and were compared using Pearson's chi-squared test. Balance between groups was assessed with standardized mean differences. Overall survival was estimated with the Kaplan–Meier method and compared with the log-rank test. Hazard ratios with 95% confidence intervals were estimated using Cox proportional hazards regression adjusted for age and ECOG performance status; the proportional hazards assumption was assessed with Schoenfeld residuals. Analyses were performed in R 4.6.0 (survival, gtsummary).
# Cox proportional hazards + Schoenfeld residual test fit_cox <- coxph(Surv(time, status) ~ age + sex + ph.ecog, data = d) zph <- cox.zph(fit_cox) t_cox <- tbl_regression(fit_cox, exponentiate = TRUE) # Runs unchanged in RStudio — no lock-in.
We studied public reviews and forum posts from researchers about their statistics software. These complaints came up again and again — here is what we do instead.
Planned launch pricing. Waitlist members will be offered a founding price first. Student and low- and middle-income country discounts of about 50%.
No. PaperStat runs R compiled to WebAssembly inside your browser tab. Your file is read locally and the analysis runs on your own computer. We never receive your data.
Yes — the same R language and the same established packages statisticians use (survival, gtsummary and others), running in the browser via WebR. The script you download runs in a normal R installation.
No. You choose variables and analyses with a point-and-click interface. The R script is there if you, a co-author or a reviewer want to check or extend the analysis.
Table 1 with automatic test selection and SMD, linear and logistic regression, Kaplan–Meier with number-at-risk tables, and Cox regression with a proportional-hazards check. Forest plots, ROC curves, mixed models, multiple imputation and meta-analysis are planned next.
We are testing the prototype now. Join the list and we'll email you when the beta opens.